0. Intro
In his post I'm going to show the monitoring of application using VisualVM and memory dump analysis using Eclipse Memory Analyzer.1. What is "memory leak"?
When the garbage collector is trying to "clean garbage" it's looking objects in heap which are unreachable (no references to this object) and removing them. So, if for some reason we're creating new object and always keeping references to them - such objects will not be removed from heap by garbage collector, and application will be using more and more memory till OutOfMemory error.- such types of problems called "memory leaks".
2. Memory leak example application
Let's now create a simple application with memory leak: we will be creating new objects and storing the references to them into list. So, the objects will not be available for garbage collecting(the will be referenced by list elements).package com.demien.memanaly; import java.util.ArrayList;import java.util.List;import java.util.UUID; public class AppMain { class User { private String name; public User(String name) { this.name = name; } public String getName() { return name; } } private List<User> users = new ArrayList<>(); public void run() throws InterruptedException { while (true) { users.add(new User(UUID.randomUUID().toString())); Thread.sleep(5); } } public static void main(String[] args) throws InterruptedException { System.out.println("Rinning"); new AppMain().run(); } }
To make everything more obvious, let's decrease available memory to 10Mb size by VM argumet -Xmx10m:
3. Run and monitor
To understand what is memory leak, we have to remind ourselves how Garbage collector works: it's trying to remove from heap "unused" objects (which are unreachable). When we created the object, used it for some time and stopped used it - it will be removed from heap by garbage collector. But in our case we don't have "unused"(unreachable) objects, because we're keeping links to all our objects in list. So there are no object for GC to collect, and occupied space in heap will be continuously increasing.For monitoring heap usage we can use visualVM tool. It can be downloaded from here.
After running, you have to install from Tools/Plugins/Available Plugins : Visual GC. After installation and running application we have to select it on the left side of the screen, and open connection:
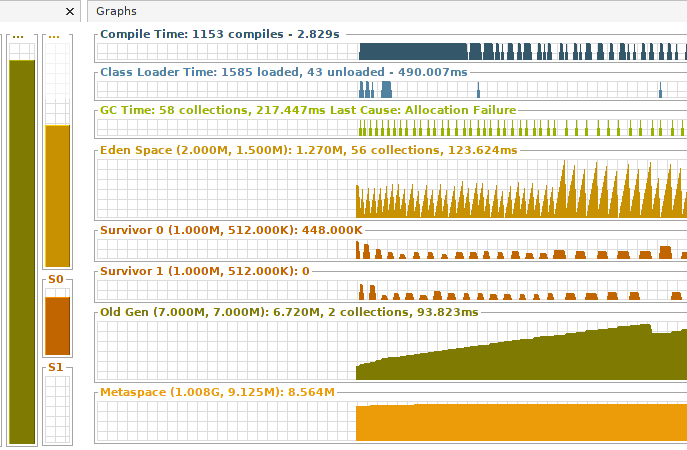
next - just switch into tab "Visual GC" from just installed plugin. It will be showing current state of all heap areas. We're interested at "Old Gen" area: as you can see, it's constantly growing. That means: GC can not remove from heap object's we're creating - something is definitely wrong with our application:
4. Memory analyzing tool(MAT)
At previous step we found that we have memory leak. Now, let's found which objects are being "mistakenly" created in heap. Of course we know that the problem is with "User" class which we're creating, but let's pretend what we don't know that :)To analyze memory usage I used eclipse memory analyzer tool(MAT), it can be downloaded from here.
We have 2 options:
- create dump using visualVM("Monitor" tab + "Head Dump" button)
- connect MAT directly to our process
I used second option:
After selecting my java process and pressing "Finish" - I selected "memory leaks" on next screen. And MAT showed me the result:
Size: 2.6 MB Classes: 499 Objects: 56.4k Class Loader: 3 Unreachable Objects Histogram
After clicking on largest (blue) area we can open list of objects with outgoing references: after several "drill-downs" we will be able to see next picture:
Of course, it's not a surprise for us: we have a very big ArrayList with objects of type User - that's our main problem. We have to stop keeping references to new new objects in arrayList and we'll be fine.


